








Modalità suggerimenti è attiva Disattiva

Prova di 7-giorni Accesso demo

  • Ottieni accesso a tutto il nostro database
  • Fai Screening come un vero professionista
  • Monitora tutti i tuoi titoli quotidianamente
  • Traccia i prezzi dei bond da oltre 400 fonti
  • Prendi decisioni ponderate, basate su dati accurati e completi

Filtra i bond in base a +50 criteri (rating, rendimento, prezzo, ecc.)

Ottieni l'accesso

QVMM - Invesco S&P MidCap 400 QVM Multi-factor ETF (USD) (US46138G5734)

Limite di confronto raggiunto: è possibile aggiungere solo 5 strumenti. Per aggiungerne uno nuovo, si prega di rimuovere uno di quelli già aggiunti.

TROVA, SALVA E MONITORA I TUOI INVESTIMENTI CON LA WATCHLIST DI CBONDS

Attraverso la Watchlist di Cbonds puoi rimanere sempre aggiornato sui tuoi investimenti per prendere decisioni consapevoli!

Watchlist
Per visualizzare questi dati è necessario un abbonamento
Cbonds API
Integra i dati di mercato nei tuoi sistemi

Accedi ai dati su ETF e fondi comuni di investimento tramite API

  • Prezzi e NAV
  • Struttura del fondo
  • Afflussi e dividendi
 
(%)
US46138G5734
QVMM ISIN
Exchange Traded Funds (ETF)
Tipologia di fondo
Invesco
Provider
34,72 USD
NAV per azione | 03/11/2026
30/06/2021
Data di inizio
4 volte l'anno
Pagamento dei dividendi
CEOJLS
CFI
QVMM
Ticker
Formed
Status
Equity
Oggetto d'investimento
Mid Cap
Settore
USA
Geografia
S&P MIdCap 400 Quality, Value & Momentum Top 90% Multi-factor Index
Benchmark
0.15 %
Rapporto costo totale
423,97 ml USD
Totale attivo del fondo | 03/11/2026
423,97 ml USD
Attività della classe azionaria | 03/11/2026
No
UCITS
USA
Paese di registrazione


7-giorni Accesso di prova

  • Ottieni l'accesso completo al nostro database
  • Utilizza il nostro potente bond screener
  • Traccia i prezzi dei bond da oltre 400 fonti primarie
  • Monitora tutti i tuoi titoli quotidianamente

Redditività su 03/11/2026, NYSE Arca

  • YTD
    12,49 %
  • 1M
    1,62 %
  • 3M
    -2,4 %
  • 6M
    2,19 %
  • 1Y
    16,78 %
  • 3Y
    57,66 %
  • 5Y
    40,05 %
  • 10Y
    -
Al prezzo di scambio, tenendo conto dei pagamenti di reddito

Ultimi dati di
Aggiungi da confrontare

Quote (QVMM)

Utilizza il più completo database finanziario

1 000 000

obbligazioni

100 000

azioni

175 910

ETF & Funds

100 000

indici

Monitora il tuo portafoglio nel modo più efficiente

  • Bond screener
  • Watchlist
  • Excel ADD-IN

Prova di 7-giorni Accesso demo

  • Ottieni accesso a tutto il nostro database
  • Fai Screening come un vero professionista
  • Monitora tutti i tuoi titoli quotidianamente
  • Traccia i prezzi dei bond da oltre 400 fonti
  • Prendi decisioni ponderate, basate su dati accurati e completi

Filtra i bond in base a +50 criteri (rating, rendimento, prezzo, ecc.)

Ottieni l'accesso

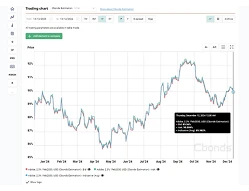
Dinamica dei prezzi

Profilo fondo

The Invesco S&P MidCap 400 QVM Multi-factor ETF (Fund) is based on the S&P MIdCap 400 Quality, Value & Momentum Top 90% Multi-factor Index (Index).The Fund will normally invest at least 90% of its total assets in common stocks that comprise the Index. The Index is designed to track the performance of a subset of securities from the S&P MidCap 400® Index that exhibit factors of quality, value and momentum.

QVMM profilo

The Invesco S&P MidCap 400 QVM Multi-factor ETF (USD) is a(n) Equity Exchange Traded Funds (ETF) seeks to invest in Mid Cap sector located in USA. The Invesco fund’s base currency is USD and the share class was registered 30.06.2021 with unique ISIN - US46138G5734. Main exchange is NYSE Arca and ticker symbol is QVMM. The total expense ratio is 0.15%. The Invesco S&P MidCap 400 QVM Multi-factor ETF (USD) pays dividends 4 time(s) per year.

Struttura QVMM su 09/10/2026

Documento Valore
Okta Inc 1,27%
TechnipFMC PLC 0,91%
ATI Inc 0,84%
nVent Electric PLC 0,84%
Entegris Inc 0,78%
United Therapeutics Corp 0,76%
US Foods Holding Corp 0,75%
XPO Inc 0,74%
Tenet Healthcare Corp 0,73%
Woodward Inc 0,65%
TD SYNNEX Corp 0,65%
Reliance Inc 0,65%
MACOM Technology Solutions Holdings Inc 0,65%
Carpenter Technology Corp 0,65%
Curtiss-Wright Corp 0,63%
Royal Gold Inc 0,62%
Burlington Stores Inc 0,61%
ITT Inc 0,59%
Ovintiv Inc 0,58%
Permian Resources Corp 0,58%
Coeur Mining Inc 0,57%
HF Sinclair Corp 0,57%
Lattice Semiconductor Corp 0,56%
Fabrinet 0,56%
MKS Inc 0,56%
WESCO International Inc 0,55%
East West Bancorp Inc 0,55%
Reinsurance Group of America Inc 0,55%
RB Global Inc 0,54%
RBC Bearings Inc 0,53%
API Group Corp 0,52%
Clean Harbors Inc 0,51%
Performance Food Group Co 0,5%
Toast Inc 0,5%
Sterling Infrastructure Inc 0,49%
SharkNinja Inc 0,48%
Lincoln Electric Holdings Inc 0,48%
Jones Lang LaSalle Inc 0,48%
RenaissanceRe Holdings Ltd 0,47%
WP Carey Inc 0,47%
ARAMARK Holdings Corp 0,46%
Pinnacle Financial Partners Inc 0,46%
Jazz Pharmaceuticals PLC 0,46%
Neurocrine Biosciences Inc 0,46%
Docusign Inc 0,46%
Semtech Corp 0,46%
Annaly Capital Management Inc 0,46%
Exelixis Inc 0,46%
Onto Innovation Inc 0,46%
Medpace Holdings Inc 0,46%
TransUnion 0,45%
CACI International Inc 0,45%
Unum Group 0,44%
Toll Brothers Inc 0,44%
Carlisle Cos Inc 0,43%
Roivant Sciences Ltd 0,43%
Graco Inc 0,43%
Mueller Industries Inc 0,43%
Manhattan Associates Inc 0,43%
MasTec Inc 0,42%
RPM International Inc 0,42%
Halozyme Therapeutics Inc 0,42%
BJ's Wholesale Club Holdings Inc 0,42%
DT Midstream Inc 0,42%
Omega Healthcare Investors Inc 0,42%
BWX Technologies Inc 0,42%
Lamar Advertising Co 0,42%
Nextpower Inc 0,41%
Crown Holdings Inc 0,41%
BorgWarner Inc 0,4%
Applied Industrial Technologies Inc 0,4%
Encompass Health Corp 0,39%
TTM Technologies Inc 0,39%
Equity LifeStyle Properties Inc 0,39%
Five Below Inc 0,39%
Elanco Animal Health Inc 0,38%
Texas Roadhouse Inc 0,38%
Rambus Inc 0,37%
Coca-Cola Consolidated Inc 0,37%
Sanmina Corp 0,36%
Arrow Electronics Inc 0,36%
Gaming and Leisure Properties Inc 0,36%
Alcoa Corp 0,36%
Regal Rexnord Corp 0,36%
Hecla Mining Co 0,35%
Service Corp International/US 0,35%
First Horizon Corp 0,35%
Essential Utilities Inc 0,35%
New York Times Co/The 0,35%
Stifel Financial Corp 0,35%
BioMarin Pharmaceutical Inc 0,35%
EastGroup Properties Inc 0,35%
Advanced Energy Industries Inc 0,35%
Affiliated Managers Group Inc 0,34%
Ally Financial Inc 0,34%
Littelfuse Inc 0,34%
Molina Healthcare Inc 0,34%
Evercore Inc 0,34%
Avantor Inc 0,34%
Moog Inc 0,34%
Altro - %
Benvenuto su Cbonds
Nuovo su Cbonds? · Ecco un tour di 90 secondi della piattaforma

Scopri cosa puoi fare con Cbonds

Tutto quello di cui hai bisogno per la ricerca e il monitoraggio del reddito fisso

  • 00:26 Copertura
  • 00:42 Bond Screener
  • 00:54 Parametri
  • 01:06 Watchlist, Mobile App
  • 01:10 Excel Add-in

Ottieni l'accesso al più grande database finanziario

Prova di 7-giorni Accesso demo

Gratuito per rappresentanti aziendali

  • Utilizza strumenti analitici avanzati
  • Ottieni l'accesso completo al nostro database
  • Prova il nostro potente bond screener
  • Traccia i prezzi dei bond da oltre 400 fonti primarie

Altri ETF & Fondi da questo provider

ETF & Fondi simili

  • {{ item.etf.ttl }}
    {{ item.nav_usd }} ml
    NAV
    {{ item.expense_ratio }}
    Rapporto costo totale
La registrazione è richiesta per ottenere l'accesso.