







Modalità suggerimenti è attiva Disattiva

Prova di 7-giorni Accesso demo

  • Ottieni accesso a tutto il nostro database
  • Fai Screening come un vero professionista
  • Monitora tutti i tuoi titoli quotidianamente
  • Traccia i prezzi dei bond da oltre 400 fonti
  • Prendi decisioni ponderate, basate su dati accurati e completi

Filtra i bond in base a +50 criteri (rating, rendimento, prezzo, ecc.)

Ottieni l'accesso

SPPQ - SPDR Bloomberg SASB U.S. High Yield Corporate ESG EUR Hdg UCITS ETF (EUR) (Acc) (IE00BYTH5602)

Limite di confronto raggiunto: è possibile aggiungere solo 5 strumenti. Per aggiungerne uno nuovo, si prega di rimuovere uno di quelli già aggiunti.

TROVA, SALVA E MONITORA I TUOI INVESTIMENTI CON LA WATCHLIST DI CBONDS

Attraverso la Watchlist di Cbonds puoi rimanere sempre aggiornato sui tuoi investimenti per prendere decisioni consapevoli!

Watchlist
Per visualizzare questi dati è necessario un abbonamento
Cbonds API
Integra i dati di mercato nei tuoi sistemi

Accedi ai dati su ETF e fondi comuni di investimento tramite API

  • Prezzi e NAV
  • Struttura del fondo
  • Afflussi e dividendi
 
(%)
IE00BYTH5602
SPPQ ISIN
Exchange Traded Funds (ETF)
Tipologia di fondo
SPDR State Street Global Advisors
Provider
34,01 EUR
NAV per azione | 03/11/2026
24/03/2022
Data di inizio
No
Pagamento dei dividendi
EUOXXR
CFI
SPPQ
Ticker
Formed
Status
Fixed Income
Oggetto d'investimento
Corporate bonds
Settore
USA
Geografia
Bloomberg SASB US Corporate High Yield ESG Ex-Controversies Select Index (EUR Hedged)
Benchmark
0.35 %
Rapporto costo totale
Physical
Metodo di replica
257,57 ml USD
Totale attivo del fondo | 03/11/2026
68,3 ml EUR
Attività della classe azionaria | 03/11/2026
Si
UCITS
Ireland
Paese di registrazione
Incluso nel piano gratuito
  • 1.000.000 + obbligazioni
  • Oltre 100.000 azioni
  • 17.000 ETF
  • 150.000 fondi comuni

Inizia a esplorare i mercati globali in meno di un minuto

  • Dati macroeconomici e sulle materie prime
  • Research Hub e notizie di mercato
  • AI Bond Screener

Redditività su 03/11/2026, XETRA

  • YTD
    -1,7 %
  • 1M
    -0,37 %
  • 3M
    -2,51 %
  • 6M
    -1,63 %
  • 1Y
    -1,03 %
  • 3Y
    18,02 %
  • 5Y
    -
  • 10Y
    -
Al prezzo di scambio, tenendo conto dei pagamenti di reddito

Ultimi dati di
Aggiungi da confrontare

Quote (SPPQ)

Utilizza il più completo database finanziario

1 000 000

obbligazioni

100 000

azioni

175 910

ETF & Funds

100 000

indici

Monitora il tuo portafoglio nel modo più efficiente

  • Bond screener
  • Watchlist
  • Excel ADD-IN

Prova di 7-giorni Accesso demo

  • Ottieni accesso a tutto il nostro database
  • Fai Screening come un vero professionista
  • Monitora tutti i tuoi titoli quotidianamente
  • Traccia i prezzi dei bond da oltre 400 fonti
  • Prendi decisioni ponderate, basate su dati accurati e completi

Filtra i bond in base a +50 criteri (rating, rendimento, prezzo, ecc.)

Ottieni l'accesso

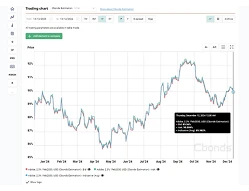
Dinamica dei prezzi

Profilo fondo

The SPDR Bloomberg SASB U.S. High Yield Corporate ESG UCITS ETF seeks to replicate as close as possible the price and yield performance of the Bloomberg SASB US Corporate High Yield ESG Ex-Controversies Select Index investing in the fixed-rate, U.S. Dollar-denominated high yield corporate bond market

SPPQ profilo

The SPDR Bloomberg SASB U.S. High Yield Corporate ESG EUR Hdg UCITS ETF (EUR) (Acc) is a(n) Fixed Income Exchange Traded Funds (ETF) seeks to invest in Corporate bonds sector located in USA. The SPDR State Street Global Advisors fund’s base currency is USD and the share class was registered 24.03.2022 with unique ISIN - IE00BYTH5602. Main exchange is XETRA and ticker symbol is SPPQ. The total expense ratio is 0.35%. The SPDR Bloomberg SASB U.S. High Yield Corporate ESG EUR Hdg UCITS ETF (EUR) (Acc) pays dividends 0 time(s) per year.

Struttura SPPQ su 03/11/2026

Documento Valore
Clarios International, 6.75% 15sep2032, USD 1,31%
Caesars Entertainment, 7% 15feb2030, USD 1,21%
Vodafone Group, 4.125% 4jun2081, USD 1,17%
PG&E, 7.375% 15mar2055, USD 1,12%
Clear Channel Outdoor Holdings, 7.125% 15feb2031, USD 1,12%
Level 3 Parent, 6.875% 30jun2033, USD 1,11%
Ball, 6% 15jun2029, USD 1,05%
Snap, 6.875% 1mar2033, USD 1,04%
Gen Digital, 6.25% 1apr2033, USD 1,04%
MGM China Holdings, 6.25% 15may2033, USD 1,02%
Commercial Metals, 5.75% 15nov2033, USD 0,99%
MPT Operating Partnership, 8.5% 15feb2032, USD 0,95%
Solaris Energy Infrastructure, 7% 1apr2032, USD 0,93%
Bombardier, 7.25% 1jul2031, USD 0,91%
Yum! Brands, 4.75% 15jan2030, USD 0,9%
RHP Hotel Properties, 6.5% 15jun2033, USD 0,89%
CROWN Americas, 5.875% 1jun2033, USD 0,88%
Grifols, 4.75% 15oct2028, USD 0,87%
Diebold Nixdorf, 7.75% 31mar2030, USD 0,87%
TELUS, 6.375% 9jun2056, USD (C) 0,86%
Unisys, 10.625% 15jan2031, USD 0,85%
Kinetik Holdings, 6.625% 15dec2028, USD 0,84%
Alcoa Nederland Holding, 7.125% 15mar2031, USD 0,8%
Genesis Energy, 6.75% 15mar2034, USD 0,8%
Caesars Entertainment, 6% 15oct2032, USD 0,79%
Ball, 3.125% 15sep2031, USD 0,76%
Avient, 6.25% 1nov2031, USD 0,75%
Clean Harbors, 6.25% 30sep2034, USD 0,75%
TGS-NOPEC Geophysical, 8.5% 15jan2030, USD 0,74%
Melco Resorts Finance, 6.5% 24sep2033, USD 0,72%
CLARIOS GLOBAL LP/US FIN 144A 6.75 02/15/2030 0,71%
Skydance, 8.25% 15oct2031, USD 0,68%
Nissan Motor, 4.81% 17sep2030, USD 0,67%
Bombardier, 8.75% 15nov2030, USD 0,65%
Chemours, 4.625% 15nov2029, USD 0,65%
Chemours, 5.75% 15nov2028, USD 0,65%
Brandywine Operating Partnership, 8.875% 12apr2029, USD 0,64%
Whirlpool Corp, 6.125% 15jun2030, USD 0,64%
Nabors Industries Inc., 9.125% 31jan2030, USD 0,64%
Park Intermediate Holdings, 7% 1feb2030, USD 0,64%
Terex, 5% 15may2029, USD 0,63%
Victoria's Secret, 4.625% 15jul2029, USD 0,63%
Hudson Pacific Properties L.P., 4.65% 1apr2029, USD 0,62%
Goodyear Tire & Rubber, 6.625% 15jul2030, USD 0,62%
Post Holdings, 6.5% 15mar2036, USD 0,61%
Chemours, 8% 15jan2033, USD 0,61%
Diversified Healthcare Trust, 4.75% 15feb2028, USD 0,6%
AmeriGas Partners, 6.875% 1jun2031, USD 0,6%
Organon & Co., 7.875% 15may2034, USD 0,6%
Vodafone Group, 7% 4apr2079, USD 0,6%
Melco Resorts Finance, 5.375% 4dec2029, USD 0,59%
Vornado Realty, 5.75% 1feb2033, USD 0,59%
Team Health Holdings, 8.375% 30jun2028, USD 0,59%
LifePoint Health, 7% 1may2034, USD 0,58%
WESCO Distribution, 6.375% 15mar2033, USD 0,56%
Forvia, 8% 15jun2030, USD 0,56%
Bell Canada, 6.875% 15sep2055, USD (A) 0,56%
Nissan Motor Acceptance, 5.3% 13sep2027, USD 0,56%
Alcoa Corp, 6.125% 15mar2030, USD 0,56%
Rakuten Group, 11.25% 15feb2027, USD 0,55%
Trekor Metals, 8.25% 1may2030, USD 0,55%
PRA Group, 8.375% 1feb2028, USD 0,54%
Ball, 2.875% 15aug2030, USD 0,53%
AMC Entertainment Holdings, 8.875% 15oct2031, USD 0,53%
New Gold, 6.875% 1apr2032, USD 0,53%
XHR, 4.875% 1jun2029, USD 0,52%
Coeur Mining, 5.125% 15feb2029, USD 0,5%
ViaSat, 7.5% 30may2031, USD 0,49%
Snap, 6.875% 15mar2034, USD 0,49%
Insulet, 6.5% 1apr2033, USD 0,49%
Whirlpool Corp, 7.5% 1jul2031, USD 0,48%
Virtusa, 7.125% 15dec2028, USD 0,48%
Tronox, 9.125% 30sep2030, USD 0,46%
Nabors Industries Inc., 8.875% 15aug2031, USD 0,45%
Capstone Copper, 6.75% 31mar2033, USD 0,44%
Xerox, 10.25% 15oct2030, USD 0,44%
Accendra Health, 9% 15jun2032, USD 0,44%
Skydance, 5.05% 15mar2042, USD 0,43%
Vermilion Energy Inc, 7.25% 15feb2033, USD 0,43%
Tenet Healthcare, 6% 15nov2033, USD 0,43%
Bausch Health Companies, 11% 30sep2028, USD 0,42%
Under Armour, 7.25% 15jul2030, USD 0,41%
Skydance, 5% 20sep2037, USD 0,4%
Bausch Health Companies, 14% 15oct2030, USD 0,4%
Lumen Technologies, 5.375% 15jun2029, USD 0,4%
Viridien, 10% 15oct2030, USD 0,4%
Level 3 Financing, 7.5% 15feb2037, USD 0,39%
Constellium, 6.375% 15aug2032, USD 0,39%
Kohls, 10% 1jun2030, USD 0,39%
Softbank Group, 9.75% 1apr2034, USD 0,39%
Nissan Motor, 4.345% 17sep2027, USD 0,38%
Garden SpinCo, 8.625% 20jul2030, USD 0,38%
Vornado Realty, 3.4% 1jun2031, USD 0,38%
Talos Production, 8% 15jul2034, USD 0,38%
Goodyear Tire & Rubber, 5.25% 15jul2031, USD 0,37%
Hudson Pacific Properties L.P., 3.25% 15jan2030, USD 0,37%
Constellium, 3.75% 15apr2029, USD 0,36%
Diversified Healthcare Trust, 4.375% 1mar2031, USD 0,35%
Atlantica Sustainable Infrastructure, 4.125% 15jun2028, USD 0,35%
CVS Health, 7% 10mar2055, USD (A) 0,34%
Altro - %
Benvenuto su Cbonds
Nuovo su Cbonds? · Ecco un tour di 90 secondi della piattaforma

Scopri cosa puoi fare con Cbonds

Tutto quello di cui hai bisogno per la ricerca e il monitoraggio del reddito fisso

  • 00:26 Copertura
  • 00:42 Bond Screener
  • 00:54 Parametri
  • 01:06 Watchlist, Mobile App
  • 01:10 Excel Add-in

Ottieni l'accesso al più grande database finanziario

Prova di 7-giorni Accesso demo

Gratuito per rappresentanti aziendali

  • Utilizza strumenti analitici avanzati
  • Ottieni l'accesso completo al nostro database
  • Prova il nostro potente bond screener
  • Traccia i prezzi dei bond da oltre 400 fonti primarie

Altri ETF & Fondi da questo provider

ETF & Fondi simili

  • {{ item.etf.ttl }}
    {{ item.nav_usd }} ml
    NAV
    {{ item.expense_ratio }}
    Rapporto costo totale
La registrazione è richiesta per ottenere l'accesso.