







Modalità suggerimenti è attiva Disattiva

Prova di 7-giorni Accesso demo

  • Ottieni accesso a tutto il nostro database
  • Fai Screening come un vero professionista
  • Monitora tutti i tuoi titoli quotidianamente
  • Traccia i prezzi dei bond da oltre 400 fonti
  • Prendi decisioni ponderate, basate su dati accurati e completi

Filtra i bond in base a +50 criteri (rating, rendimento, prezzo, ecc.)

Ottieni l'accesso

VTI - Vanguard Total Stock Market ETF (USD) (US9229087690)

Limite di confronto raggiunto: è possibile aggiungere solo 5 strumenti. Per aggiungerne uno nuovo, si prega di rimuovere uno di quelli già aggiunti. Scaricare

TROVA, SALVA E MONITORA I TUOI INVESTIMENTI CON LA WATCHLIST DI CBONDS

Attraverso la Watchlist di Cbonds puoi rimanere sempre aggiornato sui tuoi investimenti per prendere decisioni consapevoli!

Watchlist
Per visualizzare questi dati è necessario un abbonamento
Cbonds API
Integra i dati di mercato nei tuoi sistemi

Accedi ai dati su ETF e fondi comuni di investimento tramite API

  • Prezzi e NAV
  • Struttura del fondo
  • Afflussi e dividendi
 
(%)
US9229087690
VTI ISIN
Exchange Traded Funds (ETF)
Tipologia di fondo
Vanguard
Provider
339,66 USD
NAV per azione | 20/11/2026
24/05/2001
Data di inizio
4 volte l'anno
Pagamento dei dividendi
CEOJLS
CFI
VTI
Ticker
Formed
Status
Equity
Oggetto d'investimento
Large Cap
Settore
USA
Geografia
CRSP US Total Market Index
Benchmark
0.03 %
Rapporto costo totale
689.300 ml USD
Totale attivo del fondo | 31/10/2026
No
UCITS
USA
Paese di registrazione
Passivo (Indicizzato)
Stile di gestione
Incluso nel piano gratuito
  • 1.000.000 + obbligazioni
  • Oltre 100.000 azioni
  • 17.000 ETF
  • 150.000 fondi comuni

Inizia a esplorare i mercati globali in meno di un minuto

  • Dati macroeconomici e sulle materie prime
  • Research Hub e notizie di mercato
  • AI Bond Screener

Redditività su 20/11/2026, NYSE Arca

  • YTD
    1,96 %
  • 1M
    -9,83 %
  • 3M
    -9,48 %
  • 6M
    -6,13 %
  • 1Y
    7,43 %
  • 3Y
    57,7 %
  • 5Y
    50,43 %
  • 10Y
    243,62 %
Al prezzo di scambio, tenendo conto dei pagamenti di reddito

—

Ultimi dati di
Confronta

Quote (VTI)

Utilizza il più completo database finanziario

1 000 000

obbligazioni

100 000

azioni

175 910

ETF & Funds

100 000

indici

Monitora il tuo portafoglio nel modo più efficiente

  • Bond screener
  • Watchlist
  • Excel ADD-IN

Prova di 7-giorni Accesso demo

  • Ottieni accesso a tutto il nostro database
  • Fai Screening come un vero professionista
  • Monitora tutti i tuoi titoli quotidianamente
  • Traccia i prezzi dei bond da oltre 400 fonti
  • Prendi decisioni ponderate, basate su dati accurati e completi

Filtra i bond in base a +50 criteri (rating, rendimento, prezzo, ecc.)

Ottieni l'accesso

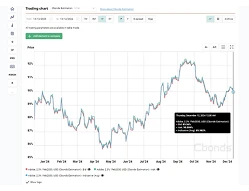
Dinamica dei prezzi —

Profilo fondo

The Vanguard Total Stock Market ETF (VTI) is a popular and widely-held ETF that tracks the performance of the CRSP US Total Market Index, a broad market index representing nearly all publicly traded U.S. stocks. It’s designed to provide investors with a simple and cost-effective way to gain broad exposure to the U.S. stock market. VTI stock trades on the NYSE Arca stock exchange under the ticker symbol VTI. The ISIN code for VTI is US9229087690. Investing in the Total US Stock Market with Vanguard Total Stock Market ETF (VTI): The CRSP US Total Market Index is a market-capitalization weighted index, meaning companies with larger market capitalizations have a greater influence on the index’s price. The index is designed to represent the performance of the total stock market in the U.S., including large, mid, and small-cap companies across all sectors. By investing in the Vanguard Total Stock Market ETF (VTI), investors gain exposure to a diversified portfolio of U.S. companies, providing a broad representation of the U.S. economy. Key Features of VTI ETF: Low-Cost: The ETF boasts a low expense ratio, making it a cost-effective way to gain exposure to the U.S. stock market. Comprehensive Coverage: The fund tracks a broad market index that represents nearly all publicly traded U.S. stocks, providing comprehensive exposure to the U.S. economy. Transparency: The fund is transparent in its holdings and operations, providing investors with clear information. Index Tracking: The fund seeks to closely track the CRSP US Total Market Index, ensuring investors are aligned with the performance of the underlying benchmark.

VTI profilo

The Vanguard Total Stock Market ETF (USD) is a(n) Equity Exchange Traded Funds (ETF) seeks to invest in Large Cap sector located in USA. The Vanguard fund’s base currency is USD and the share class was registered 24.05.2001 with unique ISIN - US9229087690. Main exchange is NYSE Arca and ticker symbol is VTI. The total expense ratio is 0.03%. The Vanguard Total Stock Market ETF (USD) pays dividends 4 time(s) per year.

Struttura VTI su 31/10/2026

Documento Valore
Apple Inc 6,9%
NVIDIA Corp 6,43%
Microsoft Corp 5,32%
Amazon.com Inc 3,2%
Alphabet Inc 2,26%
Broadcom Inc 2,13%
Meta Platforms Inc 1,86%
Alphabet Inc 1,79%
Eli Lilly & Co 1,65%
Tesla Inc 1,55%
Micron Technology Inc 1,37%
Berkshire Hathaway Inc 1,33%
JPMorgan Chase & Co 1,23%
Advanced Micro Devices Inc 1,13%
ExxonMobil Holdings Corp 1,07%
Visa Inc 0,97%
Johnson & Johnson 0,9%
Walmart Inc 0,74%
AbbVie Inc 0,72%
Mastercard Inc 0,69%
Costco Wholesale Corp 0,62%
Chevron Corp 0,61%
Palantir Technologies Inc 0,55%
Procter & Gamble Co/The 0,52%
Cisco Systems Inc 0,51%
Merck & Co Inc 0,51%
UnitedHealth Group Inc 0,5%
Coca-Cola Co/The 0,5%
Bank of America Corp 0,46%
Home Depot Inc/The 0,45%
Philip Morris International Inc 0,45%
General Electric Co 0,43%
Applied Materials Inc 0,42%
Lam Research Corp 0,41%
Palo Alto Networks Inc 0,41%
Intel Corp 0,41%
Caterpillar Inc 0,39%
Texas Instruments Inc 0,38%
RTX Corp 0,37%
Netflix Inc 0,35%
Thermo Fisher Scientific Inc 0,35%
Wells Fargo & Co 0,35%
Amgen Inc 0,35%
Goldman Sachs Group Inc/The 0,34%
Crowdstrike Holdings Inc 0,33%
International Business Machines Corp 0,33%
Linde PLC 0,33%
GE Vernova Inc 0,31%
Oracle Corp 0,31%
Morgan Stanley 0,3%
Gilead Sciences Inc 0,29%
KLA Corp 0,28%
Citigroup Inc 0,28%
Analog Devices Inc 0,28%
Amphenol Corp 0,27%
Walt Disney Co/The 0,26%
SLCMT1142 0,26%
PepsiCo Inc 0,26%
Verizon Communications Inc 0,26%
ConocoPhillips 0,25%
Abbott Laboratories 0,25%
McDonald's Corp 0,25%
Arista Networks Inc 0,25%
Union Pacific Corp 0,25%
Salesforce Inc 0,25%
NextEra Energy Inc 0,24%
Pfizer Inc 0,24%
QUALCOMM Inc 0,24%
Deere & Co 0,24%
Marvell Technology Inc 0,24%
Welltower Inc 0,23%
Sandisk Corp 0,23%
American Express Co 0,22%
Blackrock Inc 0,22%
Accenture PLC 0,22%
TJX Cos Inc/The 0,21%
Intuitive Surgical Inc 0,21%
Danaher Corp 0,2%
Lockheed Martin Corp 0,2%
AT&T Inc 0,2%
Seagate Technology Holdings PLC 0,2%
Charles Schwab Corp/The 0,2%
Eaton Corp PLC 0,2%
Vertex Pharmaceuticals Inc 0,19%
Boeing Co/The 0,19%
Progressive Corp/The 0,19%
S&P Global Inc 0,18%
Altria Group Inc 0,18%
Bristol-Myers Squibb Co 0,18%
Uber Technologies Inc 0,17%
Chubb Ltd 0,17%
Western Digital Corp 0,17%
Capital One Financial Corp 0,17%
Marathon Petroleum Corp 0,17%
Dell Technologies Inc 0,17%
Prologis Inc 0,17%
Starbucks Corp 0,16%
Medtronic PLC 0,16%
Lowe's Cos Inc 0,16%
Automatic Data Processing Inc 0,16%
Altro - %
Benvenuto su Cbonds
Nuovo su Cbonds? · Ecco un tour di 90 secondi della piattaforma

Scopri cosa puoi fare con Cbonds

Tutto quello di cui hai bisogno per la ricerca e il monitoraggio del reddito fisso

  • 00:26 Copertura
  • 00:42 Bond Screener
  • 00:54 Parametri
  • 01:06 Watchlist, Mobile App
  • 01:10 Excel Add-in

Ottieni l'accesso al più grande database finanziario

Prova di 7-giorni Accesso demo

Gratuito per rappresentanti aziendali

  • Utilizza strumenti analitici avanzati
  • Ottieni l'accesso completo al nostro database
  • Prova il nostro potente bond screener
  • Traccia i prezzi dei bond da oltre 400 fonti primarie

Altri ETF & Fondi da questo provider

ETF & Fondi simili

  • {{ item.etf.ttl }}
    {{ item.nav_usd }} ml
    NAV
    {{ item.expense_ratio }}
    Rapporto costo totale
La registrazione è richiesta per ottenere l'accesso.