Profitability is an indicator of economic efficiency. Profitability is a relative indicator that reflects the efficiency (profitability) of using various types of company resources.
The higher this indicator, the more efficiently the company operates. Profitability can be positive and negative. A negative value of this indicator indicates that the company’s activity is inefficient and brings losses.
Profitability, on the one hand, is an important indicator for investors and creditors since it allows for the assessment of the level of investment attractiveness and solvency of the company, and on the other hand, for the owners of the organization, as it makes it possible to find out how productive the company’s management is.
Profitability can be calculated on the basis of the organization’s financial statements, namely, according to the
income statement and the statement of financial position. Moreover, it can be analyzed both on the basis of
IFRS statements and on the basis of statements prepared in accordance with local standards. There are no normative values of profitability. It all depends on the industry and type of activity of the organization.
Profitability indicators can be divided into two types: return on
assets and
equity, and return on sales.
The table below shows the profitability indicators that are most often used in world practice.
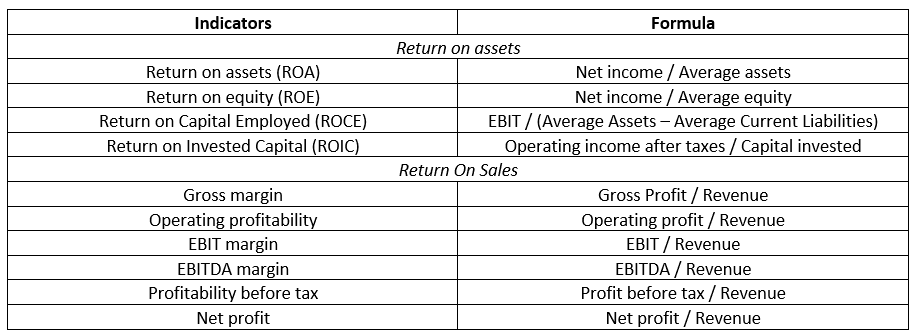
When calculating the indicators, as a rule, they are multiplied by 100%.
For example, based on
Adidas annual financial statements, as of December 31, 2021, the company had a return on assets of 9.56%, a return on equity of 28.14%, and a return on net profit of 9.97%.
And the profitability of
PHC Holdings as of March 31, 2022, calculated on the basis of net income, is negative, as the company received a net loss of -8.46 billion JPY for the financial year.