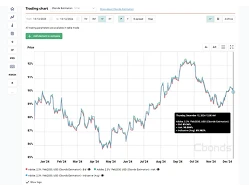










Hong Kong Yield Curve 3Y
TROVA, SALVA E MONITORA I TUOI INVESTIMENTI CON LA WATCHLIST DI CBONDS
Attraverso la Watchlist di Cbonds puoi rimanere sempre aggiornato sui tuoi investimenti per prendere decisioni consapevoli!
Filtra i bond in base a +50 criteri (rating, rendimento, prezzo, ecc.)
Ottieni l'accessoAttraverso la Watchlist di Cbonds puoi rimanere sempre aggiornato sui tuoi investimenti per prendere decisioni consapevoli!
Hong Kong yield curve for 3 years maturity, reflecting yield trends over a three-year horizon.
Il valore dell'indice può essere recuperato tramite il componente aggiuntivo Cbonds per Excel utilizzando la formula CbondsIndexValue(91525, date)
Cbonds add-in| Indice | Valuta corrente | Data |
|---|---|---|
| Hong Kong Yield Curve 1W | 2,19 % | 18/09/2026 |
| Hong Kong Yield Curve 1M | 2,65 % | 18/09/2026 |
| Hong Kong Yield Curve 3M | 2,74 % | 18/09/2026 |
| Hong Kong Yield Curve 6M | 2,99 % | 18/09/2026 |
| Hong Kong Yield Curve 9M | 3,03 % | 18/09/2026 |
| Hong Kong Yield Curve 12M | 3,07 % | 18/09/2026 |
| Hong Kong Yield Curve 2Y | 3,551 % | 18/09/2026 |
| Hong Kong Yield Curve 3Y | 3,492 % | 18/09/2026 |
| Hong Kong Yield Curve 5Y | 3,489 % | 18/09/2026 |
| Hong Kong Yield Curve 10Y | 3,72 % | 18/09/2026 |
| Hong Kong Yield Curve 15Y | 4,035 % | 18/09/2026 |
| Hong Kong Yield Curve 20Y | 4,606 % | 18/09/2026 |