







Modalità suggerimenti è attiva Disattiva

Prova di 7-giorni Accesso demo

  • Ottieni accesso a tutto il nostro database
  • Fai Screening come un vero professionista
  • Monitora tutti i tuoi titoli quotidianamente
  • Traccia i prezzi dei bond da oltre 400 fonti
  • Prendi decisioni ponderate, basate su dati accurati e completi

Filtra i bond in base a +50 criteri (rating, rendimento, prezzo, ecc.)

Ottieni l'accesso
Cbonds API
Potenzia le tue analisi con dati su indici e curve dei rendimenti

Ottieni dati sugli indici tramite API

  • Fino a 20 anni di dati storici
  • Componenti degli indici
  • Indicatori macroeconomici
  • Indici obbligazionari e azionari

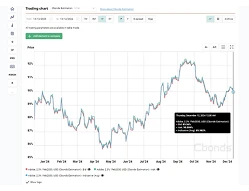
Canada: Merchandise trade, Total Import (SA, YoY%)

TROVA, SALVA E MONITORA I TUOI INVESTIMENTI CON LA WATCHLIST DI CBONDS

Attraverso la Watchlist di Cbonds puoi rimanere sempre aggiornato sui tuoi investimenti per prendere decisioni consapevoli!

Watchlist
Per visualizzare questi dati è necessario un abbonamento
mensile
%
UTC+3
Valore precedente
a 31/08/2023
da
al
AGGIUNGERE
Cbonds add-in
API
bond data api
I dati per questo indice non sono disponibili per il download
Occorre effettuare il login
Per visualizzare questi dati è necessario un abbonamento
Incluso nel piano gratuito
  • 1.000.000 + obbligazioni
  • Oltre 100.000 azioni
  • 17.000 ETF
  • 150.000 fondi comuni

Inizia a esplorare i mercati globali in meno di un minuto

  • Dati macroeconomici e sulle materie prime
  • Research Hub e notizie di mercato
  • AI Bond Screener

Descrizione dell'indice

Canadian trade statistics are compiled according to the "General" system of trade as defined by the United Nations Statistical Office. The general trade system is in use when the statistical territory of a country coincides with its economic territory. Consequently, under the general trade system, imports include all goods entering the economic territory of a compiling country, and exports include all goods leaving the economic territory of a compiling country.The closing of the statistical month for imports and exports is defined as the last calendar day of the month based on the date of clearance from Customs. Documents received too late for incorporation in the current month are assigned to the month the transaction took place and are published the following statistical month.

Quotazioni secondo i protagonisti del mercato

Elenco dei titoli per il calcolo dell'indice

Indici di sottogruppo

Indice Valuta corrente Data
Albania Imports 87.484,4 ALL Million 31/10/2026
Argentina Imports 7.060 USD Million 30/09/2026
Bahrain Imports 439,4 BHD Million 30/09/2026
Armenia Imports 1.101 USD Million 30/09/2026
Australia Imports 45.609 AUD Million 30/09/2026
Austria Imports 15.572 EUR Million 31/08/2026
Bangladesh Imports 720,38 BDT Billion 31/08/2026
Barbados Imports 401.739 BDS Thousand 30/09/2026
Belarus Imports 4.922,2 USD Million 30/09/2026
Belgium Imports 46.892,5 EUR Million 30/09/2026
Belize Imports 241,8 BZ $ Million 30/09/2026
Bolivia Imports 1.121,2 USD Million 30/09/2026
Bosnia and Herzegovina Imports 2.859.567 BAM Thousand 30/09/2026
Botswana Imports 8.214,5 BWP Million 31/08/2026
Brazil Imports 28.489,7 USD Million 31/10/2026
Brunei Imports 870 Million BND 31/08/2026
Bulgaria Imports 5.315 BGN Million 30/09/2026
Burundi Imports 288.134,6 BIF Million 31/08/2026
Cambodia Imports 14.076,8 KHR Billion 31/07/2026
Cameroon Imports 1.150 CFA Franc Billion 31/03/2025
Canada Imports 73.200 CAD Million 30/09/2026
Cape Verde Imports 11.569 CVE Million 30/09/2026
Chile Imports 7.735 USD Million 31/10/2026
China Imports 307,05 USD Billion 31/10/2026
Colombia Imports 8,193 USD Billion 30/09/2026
Costa Rica Imports 20.272,3 USD Million 30/09/2026
Cote D Ivoire Imports 838,2 XOF Billion 31/08/2026
Sao Tome and Principe Imports 25,75 USD Million 31/07/2026
Croatia Imports 4.273 HRK Million 30/09/2026
Saudi Arabia Imports 71.638 Million SAR 31/08/2026
Cyprus Imports 1.489.576 EUR Thousand 30/09/2026
Czech Republic Imports 433.126 CZK Million 30/09/2026
Denmark Imports 170.536,8 DKK Million 30/09/2026
Dominican Republic Imports 2.909,6 USD Million 30/06/2026
East Timor Imports 97.531,26 USD Thousand 30/09/2026
Uzbekistan Imports 39.560,4 USD Million 30/09/2026
Ecuador Imports 3.540.206 USD Thousand 31/08/2026
Egypt Imports 11.071 USD Million 31/08/2026
El Salvador Imports 1.697,17 USD Million 30/09/2026
Estonia Imports 2.049 EUR Million 30/09/2026
Faroe Islands Imports 1.002.239,2 DKK Thousand 31/08/2026
Fiji Imports 703.823 FJD Thousand 31/08/2026
Finland Imports 7.895 EUR Million 30/09/2026
France Imports 62.655 EUR Million 30/09/2026
Gambia Imports 21.605.144 GMD Thousands 31/03/2025
Georgia Imports 1.806 USD Million 30/09/2026
Germany Imports 126 EUR Million 30/09/2026
Ghana Imports 1.812,9 USD Million 30/04/2026
Greece Imports 8.081,1 EUR Million 30/09/2026
Guatemala Imports 3.432 USD Million 30/09/2026
Haiti Imports 360,03 USD Million 30/09/2025
Honduras Imports 1.916 USD Million 31/08/2026
Hong Kong Imports 808.903 HKD Million 30/09/2026
Hungary Imports 15.343,02 HUF Million 30/09/2026
Iceland Imports 165.077,1 ISK Million 31/10/2026
India Imports 89 USD Million 31/10/2026
Indonesia Imports 24.234,9 USD Million 30/09/2026
Ireland Imports 15.403.029 EUR Thousand 30/09/2026
Israel Imports 10.587,4 USD Million 31/10/2026
Kazakhstan Imports 5.761,8 USD Million 30/09/2026
Kenya Imports 284.751 Million KES 31/08/2026
Kosovo Imports 643.410 EUR Thousand 30/09/2026
Kyrgyzstan Imports 1.370 USD Million 31/08/2026
Latvia Imports 2.361,6 EUR Million 30/09/2026
Lebanon Imports -1.413,85 USD Million 31/12/2025
Liberia Imports 313,3 USD Million 31/07/2026
Lithuania Imports 4.522,3 EUR Million 30/09/2026
North Macedonia Imports 1.186.423 USD Thousand 30/09/2026
Madagascar Imports 2.234.239 million MGA 30/06/2026
Malawi Imports 337.418 MWK Million 30/09/2026
Malaysia Imports 181.388,95 MYR Million 30/09/2026
Maldives Imports 419,3 USD Million 31/08/2026
Malta Imports 858 EUR Thousand 30/09/2026
Mauritius Imports 30.038 MUR Million 31/08/2026
Mexico Imports 78.403 USD Million 30/09/2026
Moldova Imports 1.068,7 USD Million 30/09/2026
Mongolia Imports 1.259,6 USD Million 31/10/2026
Montenegro Imports 404.156 EUR Thousand 30/09/2026
Myanmar Imports 4.669,7 USD Million 30/06/2023
Nepal Imports 214.075,4 Million NPR 31/08/2026
Netherlands Imports 60.511 EUR Million 31/08/2026
New Caledonia Imports 22.357 XPF Million 31/08/2026
New Zealand Imports 9.723,98 NZD Million 31/10/2026
Nicaragua Imports 1.077,6 USD Million 31/08/2026
Nigeria Imports 4.852.803,77 NGN Millions 30/06/2026
Norway Imports 108.244 NOK Million 31/10/2026
Oman Imports 1.623 OMR Million 31/08/2026
Pakistan Imports 1.887.552 PKR Million 31/10/2026
Palestine Imports 776,6 USD Million 31/08/2026
Paraguay Imports 1.849.860 USD Thousand 31/10/2026
Peru Imports 6.325,9 USD Million 30/09/2026
Philippines Imports 15.028.940 USD Thousand 30/09/2026
Poland Imports 35.056 EUR Million 30/09/2026
Portugal Imports 10.818,47 EUR Million 30/09/2026
Puerto Rico Imports 4.319,5 USD Million 31/08/2026
Qatar Imports 6.055 QAR Million 31/03/2026
Romania Imports 12.540 EUR Million 30/09/2026
Russia Imports (according to the balance of payments methodology) 30.531 USD Million 30/09/2026
Rwanda Imports 641,4 USD Million 31/08/2026
Senegal Imports 551,1 CFA Franc Billion 31/08/2026
Serbia Imports 4.323 USD Million 30/09/2026
Seychelles Imports 95,31 USD Million 30/09/2026
Sierra Leone Imports 139,09 USD Million 30/06/2025
Slovakia Imports 10.109 EUR Million 30/09/2026
Slovenia Imports 6.499,71 EUR Million 30/09/2026
South Africa Imports 170.794,52 ZAR Million 30/09/2026
South Korea Imports 72.780 USD Million 31/10/2026
Spain Imports 43.979.200 EUR Thousand 30/09/2026
Sri Lanka Imports 2.108,6 USD Million 30/09/2026
Sudan Imports 1.121.991 USD Thousand 31/12/2022
Sweden Imports 202.300 SEK million 30/09/2026
Tajikistan Imports 3.077.911,2 USD Million 30/06/2026
Tunisia Imports 8.449,8 TND Million 31/10/2026
Turkey Imports 32.584 USD Million 31/10/2026
Uganda Imports 2.402,1 USD Million 30/09/2026
United Kingdom Imports 88.516 GBP Million 30/09/2026
United States Imports 427 USD Million 30/09/2026
Uruguay Imports 1.175.415 USD Thousand 30/09/2026
Vietnam Imports 57 USD Billion 31/10/2026
Zambia Imports 36.355 ZMK Million 30/09/2026
Zimbabwe Imports 1.152,4 USD Million 31/08/2026
Canada: Merchandise trade, Total Import (SA, YoY%) -0,6 % 30/09/2023
Euro Area Imports 282.950,3 EUR Million 30/09/2026
Italy Imports 56.093 EUR Million 30/09/2026
Japan Imports 12.245,3 JPY Billion 31/10/2026
Japan: Merchandise Trade Imports (NSA, YoY%) 21,6 % 31/10/2026
Jordan Imports 1.745.964 JOD Thousands 31/07/2026
Luxembourg Imports 2,2 EUR billion 31/08/2026
Macau Imports 13.629.920 MOP thousand 30/09/2026
Morocco Imports 90.486 MAD Million 30/09/2026
Panama Imports 1.519.481 PAB Thousand 30/09/2026
Russia Import according to the FCS cumulative total 229,749 USD Billion 30/09/2026
Russia Imports according to the FCS 19.964 USD Million 31/01/2024
Singapore Imports 85.586,5 Million SGD 31/10/2026
Switzerland Imports 21.881 Million CHF 30/09/2026
Taiwan Imports 68.885,4 USD Million 31/10/2026
Thailand Imports 44.295,6 USD Million 30/09/2026
Ukraine Imports 7.566,7 USD Million 30/09/2025

Composizione della lista per l'indice

I dati sono disponibili tramite export
Benvenuto su Cbonds
Nuovo su Cbonds? · Ecco un tour di 90 secondi della piattaforma

Scopri cosa puoi fare con Cbonds

Tutto quello di cui hai bisogno per la ricerca e il monitoraggio del reddito fisso

  • 00:26 Copertura
  • 00:42 Bond Screener
  • 00:54 Parametri
  • 01:06 Watchlist, Mobile App
  • 01:10 Excel Add-in

Ottieni l'accesso al più grande database finanziario

Prova di 7-giorni Accesso demo

Gratuito per rappresentanti aziendali

  • Utilizza strumenti analitici avanzati
  • Ottieni l'accesso completo al nostro database
  • Prova il nostro potente bond screener
  • Traccia i prezzi dei bond da oltre 400 fonti primarie
La registrazione è richiesta per ottenere l'accesso.